NMEA ログから衛星のスカイビューを生成する
既にある NMEA のログから、どの衛星が強く受信できているかをプロットしてみる。
ファイルを指定して png を書き出すコードを node で書いた。かなり量の多いログでも中間結果を見ながら生成できるようにしてある。
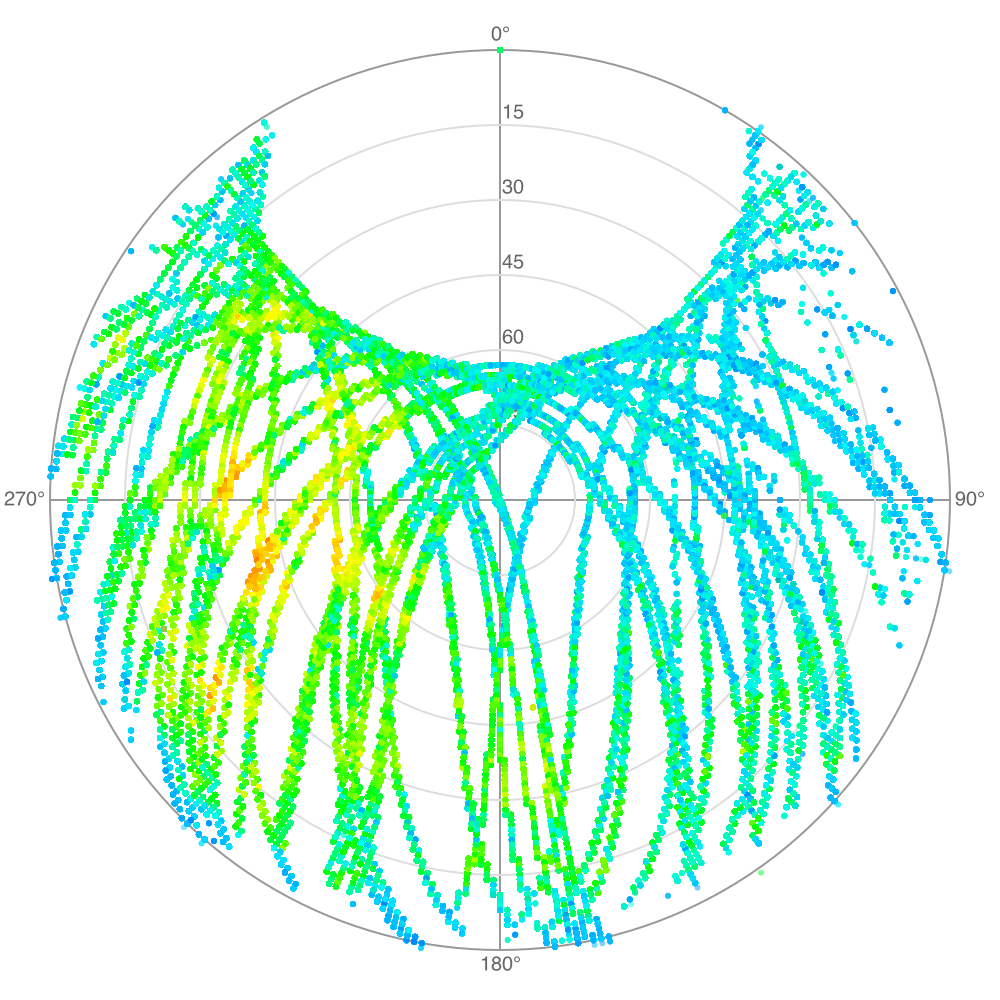
グラフの見方
上下左右が方角。右まわりに上から北・東・南・西
中心からの距離が仰角。中心が真上(90°)で、円周上が水平線(0°)
SNR によって色がついている。
自宅の状況
GPS の GSV しかとっていないので、このプロットにはGLONASSやQZSSは含まれていない。
南西向きの窓際にアンテナがあるため、そのあたりのSNRが大きくなる。
北極・南極の上空は衛星の軌道がない。北半球に住んでいる場合、このプロットのように北極上空にあたる部分に空白ができる。
決まった数の衛星が決まった軌道で飛んでいるので、空全体で見ると塗りつぶされないところは多い。
コード
#!/usr/bin/env node

const GPS = require("gps");
const fs = require("fs");
const readline = require("readline");
const { createCanvas, loadImage } = require('canvas');

const WIDTH = 1000;
const HEIGHT = 1000;
const PADDING = 50;

const PLOT_RADIUS = (WIDTH - PADDING * 2) / 2;

const canvas = createCanvas(WIDTH, HEIGHT);
const ctx = canvas.getContext('2d');
ctx.fillStyle = "#ffffff";
ctx.fillRect(0, 0, 1000, 1000);

ctx.translate(WIDTH / 2, HEIGHT / 2);

ctx.strokeStyle = "#999999";
ctx.lineWidth = 2;
ctx.beginPath();
ctx.arc(0, 0, PLOT_RADIUS, 0, 2 * Math.PI);
ctx.stroke();

ctx.beginPath();
ctx.moveTo(0, -PLOT_RADIUS);
ctx.lineTo(0, +PLOT_RADIUS);
ctx.moveTo(-PLOT_RADIUS, 0);
ctx.lineTo(+PLOT_RADIUS, 0);
ctx.stroke();

ctx.font = "20px sans-serif";
ctx.fillStyle = "#666666";
ctx.textAlign = "center";
ctx.textBaseline = "bottom";
ctx.fillText("0°", 0, -PLOT_RADIUS - 5);

ctx.textAlign = "left";
ctx.textBaseline = "middle";
ctx.fillText("90°", PLOT_RADIUS + 5, 0);

ctx.textAlign = "center";
ctx.textBaseline = "top";
ctx.fillText("180°", 0, PLOT_RADIUS + 5);

ctx.textAlign = "right";
ctx.textBaseline = "middle";
ctx.fillText("270°", -PLOT_RADIUS - 5, 0);

ctx.textAlign = "left";
ctx.textBaseline = "bottom";
for (let ele of [75, 60, 45, 30, 15]) {
	const r = elevationToRadius(ele);
	ctx.strokeStyle = "#dddddd";
	ctx.lineWidth = 2;
	ctx.beginPath();
	/*
	ctx.moveTo(r, 0);
	ctx.lineTo(r, 10);
	*/
	ctx.arc(0, 0, r, 0, Math.PI * 2);
	ctx.stroke();
	ctx.fillText(ele, 2, -r-2);
}

const gps = new GPS();

function elevationToRadius(e) {
	return PLOT_RADIUS * (1 - e / 90);
}

function writeToPng() {
	const out = fs.createWriteStream("test.png");
	const stream = canvas.createPNGStream();
	stream.pipe(out);
	out.on('finish', () =>  console.log('The PNG file was created.'));
}

//const prns = new Set();
let count = 0;
gps.on('data', function(parsed) {
	if (parsed.type !== "GSV") return;
	for (let sat of parsed.satellites) {
		if (sat.snr === null) continue;
		// prns.add(sat.prn);
		// console.log(Array.from(prns.keys()));
		const hue = (1 - (sat.snr / 40)) * 240;
		const x = Math.cos(sat.azimuth / 180 * Math.PI - Math.PI / 2) * elevationToRadius(sat.elevation);
		const y = Math.sin(sat.azimuth / 180 * Math.PI - Math.PI / 2) * elevationToRadius(sat.elevation);

		ctx.fillStyle = `hsla(${hue}, 100%, 50%, 0.5)`;
		// ctx.fillRect(x-1, y-1, 3, 3);
		ctx.beginPath();
		ctx.arc(x, y, 3, 0, 2 * Math.PI);
		ctx.fill();

		if (count % 100000 === 0) {
			writeToPng();
		}

		count++;
	}
});


const stream = fs.createReadStream("./log.log", "utf8");

const reader = readline.createInterface({ input: stream });
reader.on("line", (data) => {
	const nmea = data.substring("[2020-01-09T09:33:05.622] [DEBUG] default - ".length);
	if (/^\$GPGSV/.test(nmea)) {
		gps.update(nmea);
	}
});
reader.on("close", () => {
	console.log('done');
	writeToPng();
}); 関連エントリー
- Node.js の fs モジュールだけで GPIO の割込みを扱うには? 以下のようにすれば動くことが確認できた。 select や poll を明示的に呼び出すことができないが、edge を設定しさえすれば fs...
- HTML5 の svg 要素 を canvas に描く方法 こうする async function loadAsImage(svg) { return new Promise((resolve, re...
- 見出しの改行位置を適正化する試み やりたいのは 1文字だけの改行の拒否 - Hail2u のようなことの延長です。長めの見出しがブラウザによって改行されると、どうもバランスが...
- C言語のポインタ配列の const の効果 ポインタ配列の const が理解できなかったのでメモ 検証コード const char* const foo[] = {"foo","ba...
- Benchmark.js の結果表示を改善する Benchmark.js ちゃんと使えるので良いのですが、計測を頑張っている割に結果表示が貧弱というのが悲しいところです。 なので Perl...